Sector Rotation Dashboard
Relative strength rankings across 41 sector ETFs mapped to the engine's 141-symbol universe.
Updated daily. Dashboard generated independently from the anomaly detection engine.
Reading the Dashboard
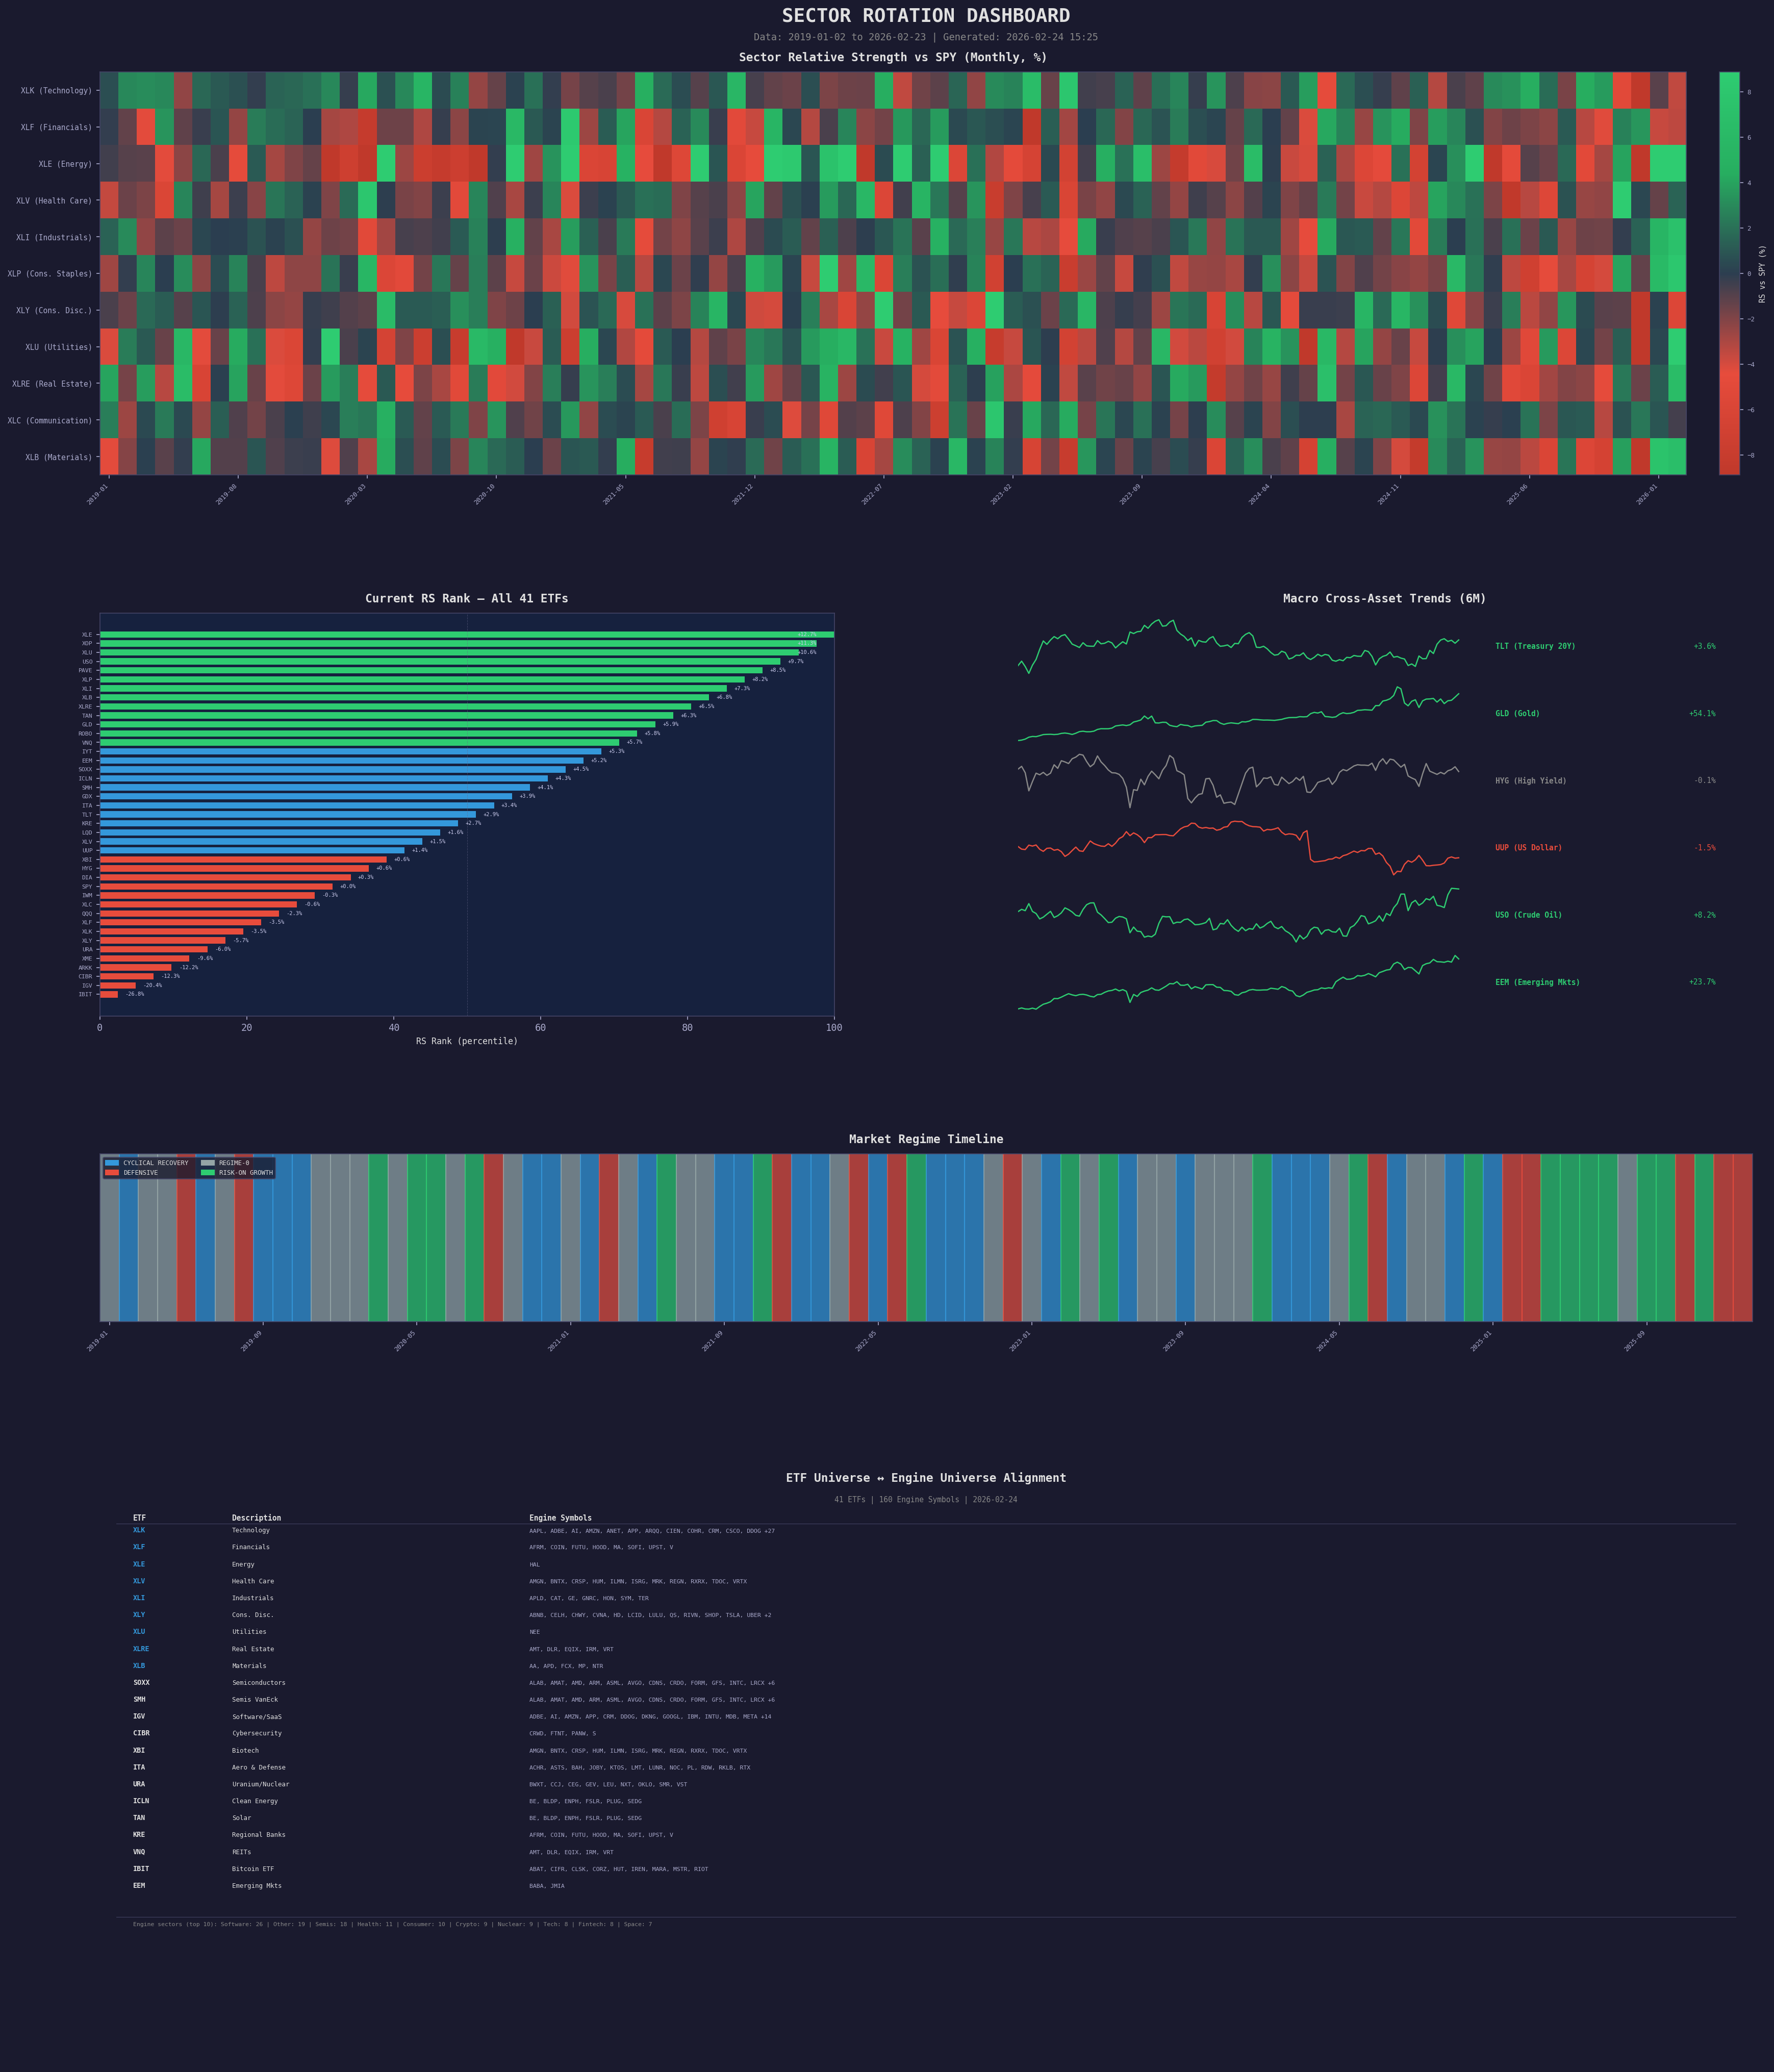
Heatmap (Top)
Monthly relative strength vs SPY for each SPDR sector ETF. Green indicates outperformance, red indicates underperformance. Patterns show sector rotation cycles over time.
RS Rank (Middle Left)
Current relative strength percentile ranking for all 41 tracked ETFs. Higher percentile = stronger momentum relative to the broad market.
Macro Trends (Middle Right)
6-month cross-asset trend lines: Treasuries, Gold, High Yield, US Dollar, Crude Oil, and Emerging Markets. Context for the macro environment driving sector rotation.
Regime Timeline (Bottom)
Historical market regime classification: Cyclical Recovery, Expansion, Slowdown, and Contraction. The current regime influences which sectors the engine's universe is most exposed to.
Universe Alignment
The bottom section of the dashboard maps each sector ETF to the engine symbols within that sector. This alignment helps contextualize which parts of the engine's universe are currently favoured by macro conditions and sector momentum.